Understanding your ecommerce analytics and setting benchmarks for conversion rate optimisation

Tags
Interested in joining the world's leading print on demand platform?
Making tweaks to improve the conversion rate of your ecommerce store is very important but as Sherlock Holmes once said: "It is a capital mistake to theorise before one has data."
You don't need to be a fictional detective to agree with his statement. Nor do you need to be one to uncover your ecommerce store analytics. Luckily for you, the conversion rate data is usually right in front of your eyes. All you need to do is learn how to interpret it and optimise it for even better results.
In under to improve the results of your ecommerce store, it's important to set up some benchmarks. Without benchmark metrics, any efforts to make improvements, such as increasing your store conversion rate, is like shooting in the dark.
Benchmarking allows you to define key metrics that you can use as reference points to compare and contrast against industry averages in order to identify potential areas for improvement.
Additionally, when a benchmark shows that your store is above average in a particular metric, you can rest assured that you're on the right track and avoid wasting time trying to fix what isn't broken.
In this article, we're going to explore our top 5 benchmarks to monitor, how you can find yours, and run through an example of a benchmark analysis with some recommended tools you can use to take your benchmarking to the next level.
Top 5 benchmarks to monitor
1. Store conversion rate
Your conversion rate shows you how many of your website visitors convert into customers, as any ecommerce agency can tell you. This is a very important benchmark to monitor because slight changes to your website–like changing the colour of the 'Add to Basket' button–could decrease or increase the amount of conversions you get. Of course, the higher your conversion rate, the better!
The average conversion rate for online stores globally is 2.86%. Calculating your conversion rate is easy. All you need to do is divide the number of orders by number of visitors. So if, on average, 1 out of every 100 visitors performs a checkout, then your conversion rate is 1%.
If you host your store on Shopify or BigCommerce then you don't need to worry about the maths, they do it for you!
To find your conversion rate in Shopify, click 'Analytics' then 'Dashboard':
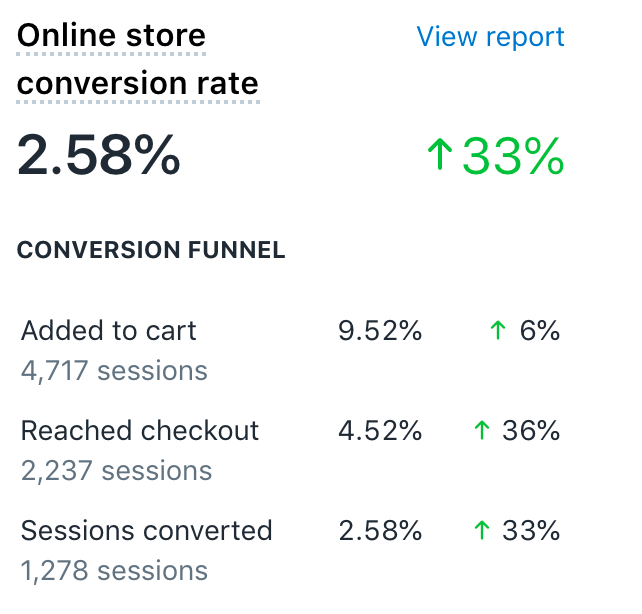
There you'll find your conversion rate (which we'll look at in more detail shortly).
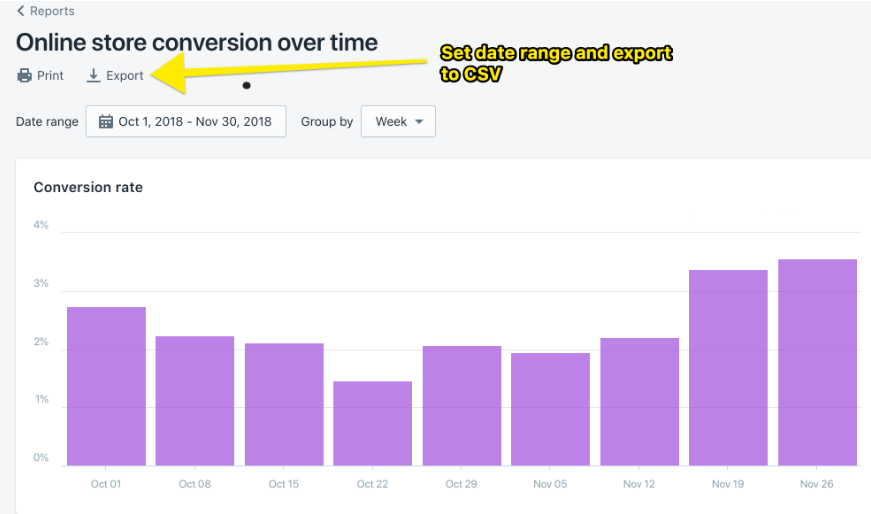
If you click 'View Report' you can set a date range grouped by day, week or month and export to CSV to view more detailed metrics:
Similarly, if you're using BigCommerce you can head to the 'Analytics section' and your conversion rate will be clearly displayed in the overview section:
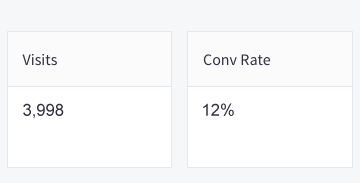
As you can see, 'visits' is right alongside this so you can get a better idea of how many people are converting into customers. Track this over time. It's a core metric that you will want to be able to influence with conversion rate optimisation efforts.
2. Repurchase rates
It can cost an incredible 5x as much to attract a new customer, than it does to keep an existing one. With that in mind, your repurchase rate is a great benchmark to measure because it allows you to see how many of your customers come back to your site again and again.
On average, ecommerce stores have a repeat customer rate of around 5% so you want yours to be around that mark, or higher if possible. If your repurchase rate is low then consider implementing a loyalty programme, or email marketing, to keep existing customers coming back for more.
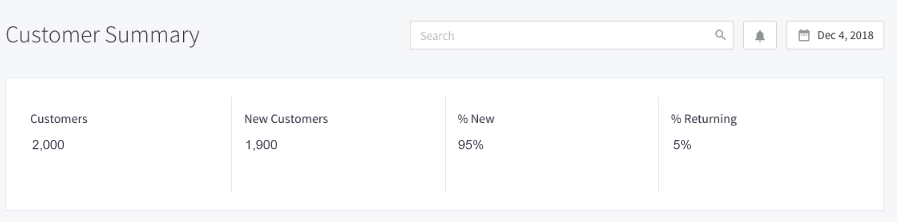
To find your repurchase rate on Shopify, head to your analytics dashboard and find the chart labelled 'Returning customer rate':
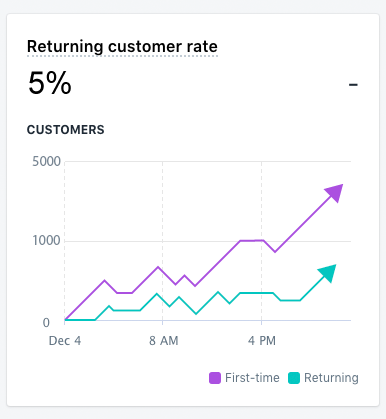
The purple line represents first-time customers and the green line represents your returning customer rate.
On BigCommerce, click on Analytics and then the Customers tab to find out how many of your customers are returning:
3. Abandoned cart rates
There are a number of potential reasons for this happening. Some customers leave because they dislike the checkout process, others because of shipping costs, and some because they got distracted or got cold feet.
Average cart abandonment rate is about 76%. That is a lot of people clicking away before they make a purchase.
This statistic varies across industry so it may be worth researching to find out the average cart abandonment rate for yours specifically. Use this figure as a benchmark against your own abandonment rate. If your figure is high you probably need to look at streamlining your checkout process.
You want to make it as easy as possible for customers to convert.
A common quick fix for a high abandonment rate is to offer free shipping to your customers. You shouldn't have to take a loss when you do this. With careful planning you can bundle average shipping costs into your product pricing. This way when people add products to their cart and then go to checkout, they won't get a surprise when they see shipping costs and then decide against the purchase.
To find your abandonment rate on Shopify, you need to take a closer look at your conversion data:
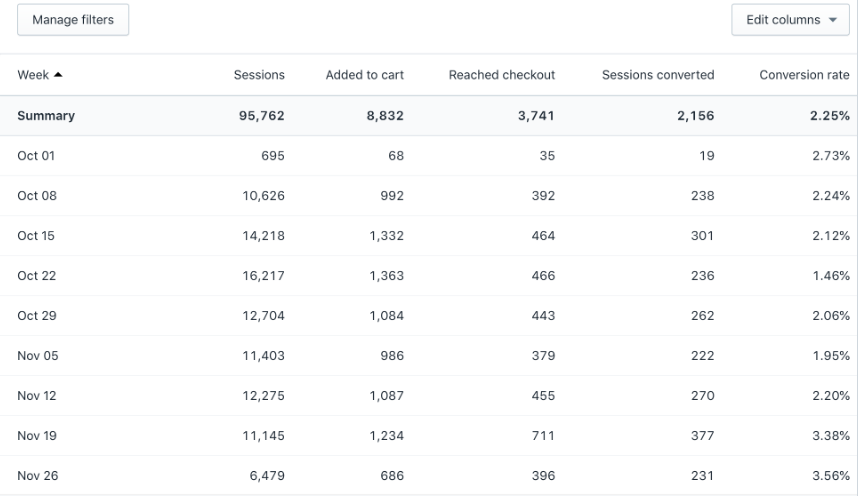
You need to calculate what percentage gap of users who 'added to cart' and users with 'sessions converted'. This will give you the % of users who abandoned their cart.
For example using the summary data above:
- Purchases not completed = purchases initiated (added to cart) less purchases completed (sessions converted) = 8,832 − 2,156 = 6,676.
- Abandonment rate = Not completed / Customer initiation = 6,676 / 8,832 = 75% abandonment rate.
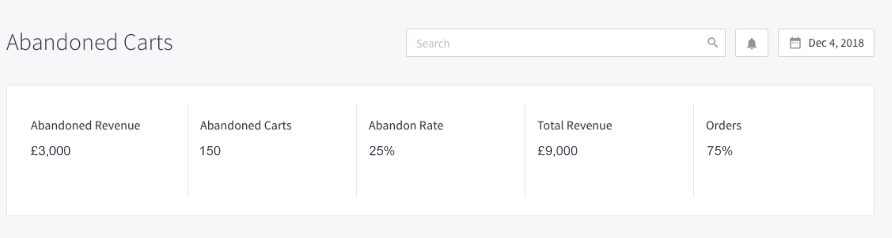
On BigCommerce, head to the 'Abandoned Carts' tab to see a clear overview of your abandon rate and also how many orders you've lost:
Another simple tactic to influence this particular benchmark is to implement an abandoned cart email sequence which sends an email reminder to people (ideally those who have opted in to communications) with a reminder to complete the purchase. This can be surprisingly effective and both Shopify and BigCommerce have built-in functionality for automated abandoned cart messaging, as well as several more custom options in their app stores.
4. Bounce rates
When people come to your site — for example by having searched for a product in Google, or clicking on a link in a blog, or through a paid advertisement — but then leave immediately without performing any action, it's known as a 'bounce'. And despite the fun name, a high bounce rate is not good.
When people leave your site without doing anything, regardless of how they got there, it sends a signal to search engines that your site is not useful to visitors. This is bad for your visitors too because clearly they did not find what they were looking for.
According to the latest data, somewhere between 30 and 55% is an acceptable bounce rate.
If your bounce rate is higher than this, it could signal that your website isn't user-friendly. Perhaps it's too busy and difficult to navigate, or it could mean that your store is not in line with what visitors are expecting when they arrive on your site.
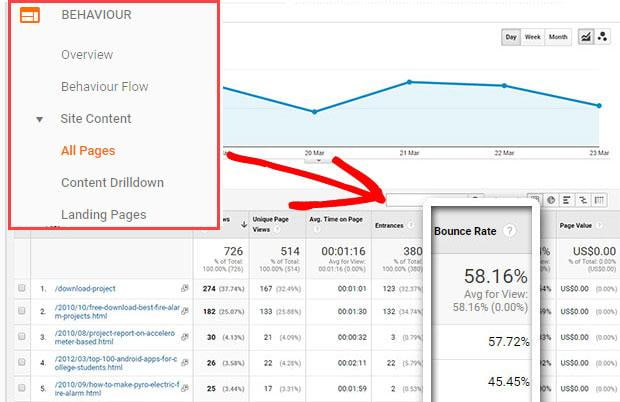
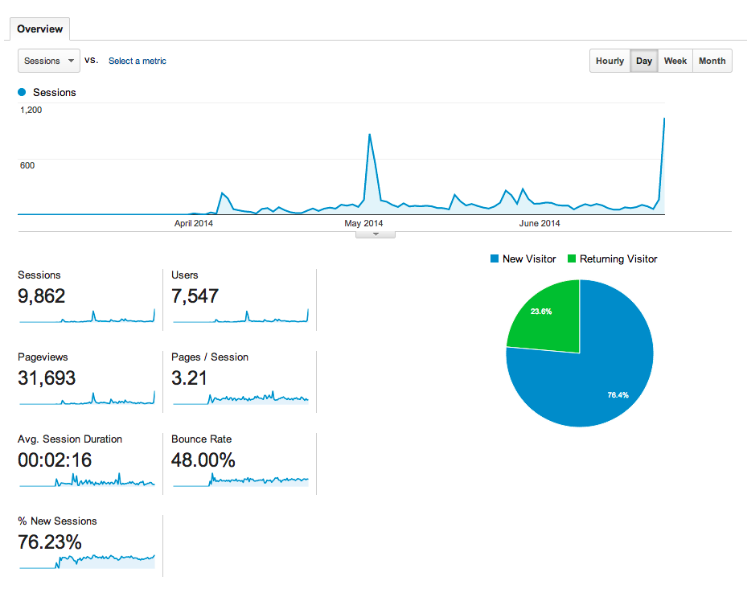
You can monitor your bounce rate via Google Analytics. This can be found by clicking Behaviour and then 'all pages' under the Site Content tab:
5. Email conversion rates
Email is consistently the top referring channel in ecommerce with an average conversion rate from email clicks to orders placed of around 3%.
If your conversion rate is below this, you should focus on running experiments designed to improve clicks to purchases. For example, a redesign of email templates, a review of offers, or a re-permission campaign to clean out your email list and get rid of zombie subscribers.
You should be able to find your email conversion rate through your mail provider, and you'll also be able to set up experiments through your provider too. If you don't have a mail provider, some popular choices are MailChimp and SendGrid.
You can also track email conversions through Google Analytics. This article does a great job of explaining how.
Benchmarking in action: Setting experiments & making improvements
So now you know what to measure, let's focus on how to set experiments and make improvements. Here we have an example of analytics for an ecommerce store:
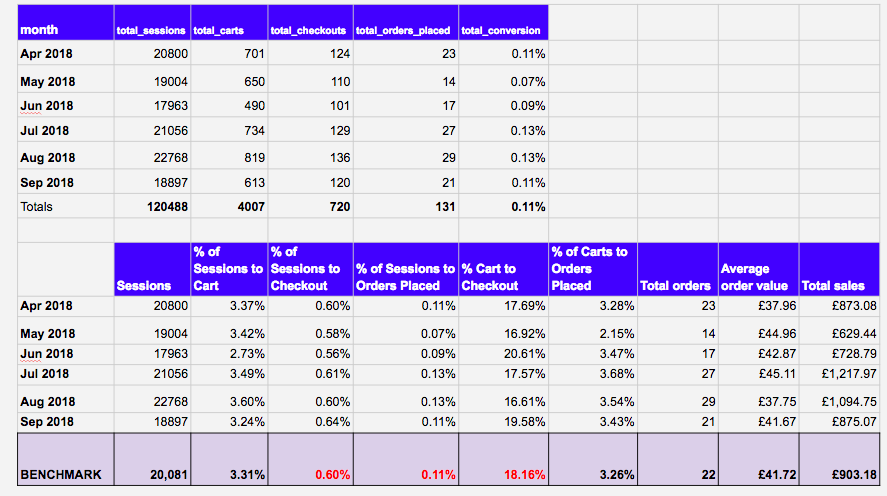
As you can see in the example listed above, some of the benchmarks (highlighted in red) are not performing well. At first glance, the sessions to cart is very promising, at 3.31%. However, even with an assumed 25% abandoned cart rate, there is a steep drop between this and sessions to checkout (0.6%), and even less customers are actually placing orders (0.11%).
This is a clear indicator that there is something in the checkout process that is causing an unusually high drop off.
Before going any further, we need to decide what we want the outcome of our experiments to be. In this case, we want our metrics to reach the industry standard:
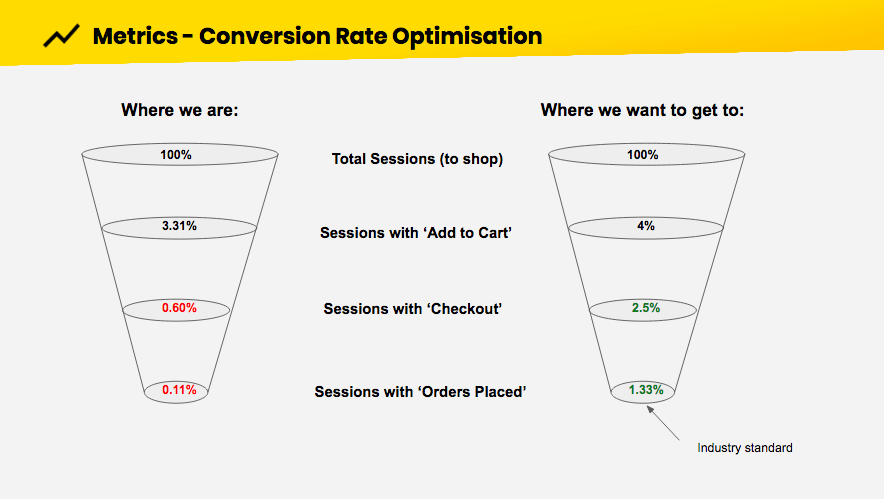
To do this, we could conduct the following experiments and monitor our chosen metrics to see if they improve:
- Implement automated abandoned cart email
- Simplify checkout process
- Free shipping offer
For clearest results, conduct each experiment individually for a certain amount of time and then compare the data from each to see which improves your metrics most. At the end of your experiments, you may want to implement all of your changes, or just a few.
Here are some tips for experiments you could do to improve the three metrics above.
Abandoned cart emails
There are a number of reasons why website visitors abandon carts. A study of almost 20,000 consumers by WorldPay determined the reasons why they leave ecommerce sites without paying:
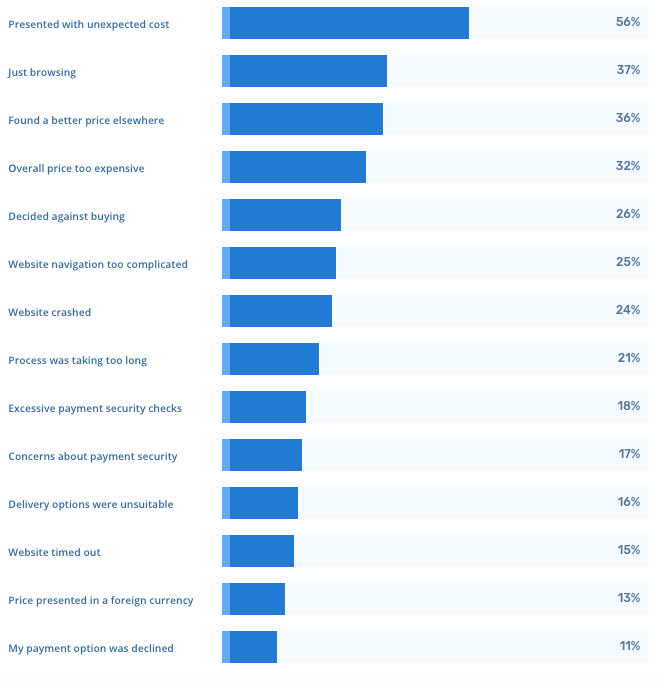
Quite the list! Whatever the reason, a follow-up email could persuade them to change their mind.
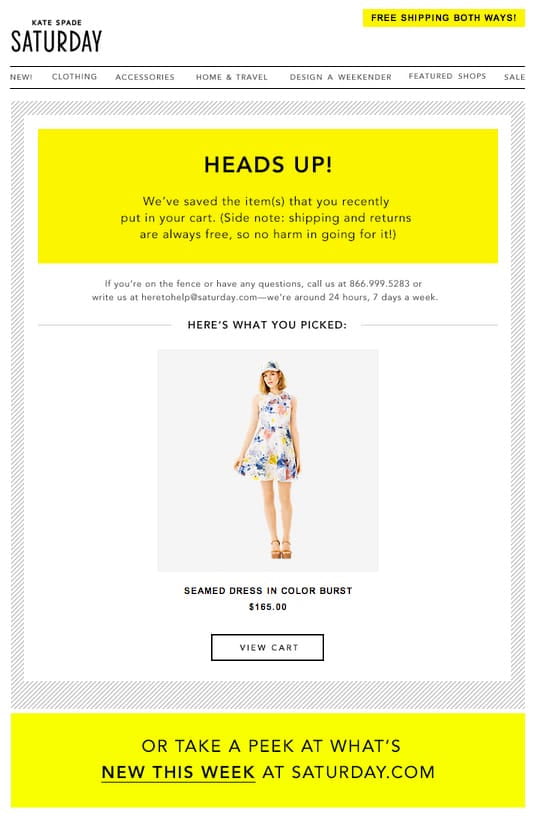
An email like this one reminds customers that their shopping cart has been saved and it also addresses potential problems by reassuring customers that shipping and returns are always free.

Similarly, this email offers a discount to visitors who abandoned their cart just in case they were part of the 36% of people that "find a better price elsewhere".
If you're using BigCommerce, they have an Abandoned Cart Saver tool that automatically recovers 15% of lost sales (on average).
Simplify checkout process
As you can see from the chart above, 25% of people abandon carts because the website navigation is too complicated.
Your checkout is one of the main parts of your website that you should A/B test, because it is arguably the most important part for conversions. Test your checkout screen with various different layouts to determine which is the most customer-friendly.
In general, a clean page with few distractions and clear CTA buttons is favoured by customers, like this:
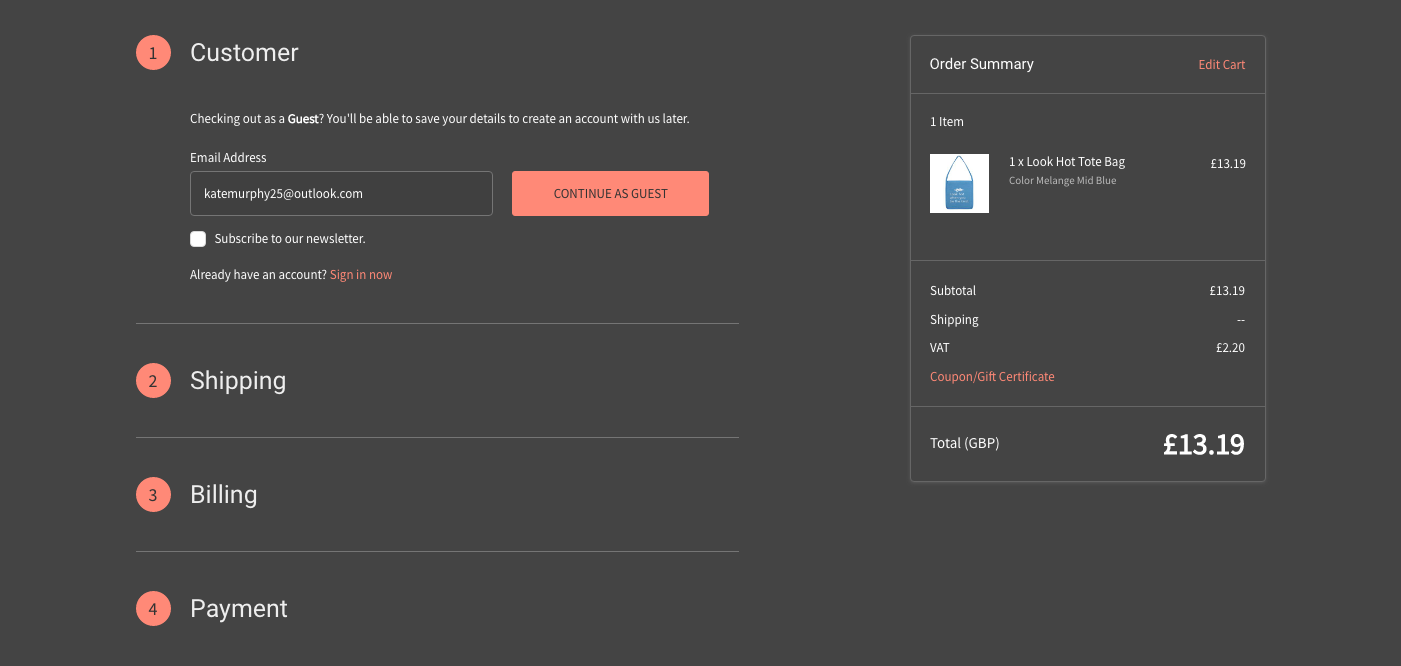
It also helps to let users checkout as a guest and pay with an easily accessible payment option, like PayPal. Basically, the fewer obstacles there are, the better!
Free shipping offer
You may think that you can't afford to offer free shipping. But the truth is, competition is so fierce that if you don't, your customers may look elsewhere. Also, free shipping doesn't need to cost you anything.
All you need to do is work the cost of shipping into your product prices. Of course, this means your products will be more expensive, but consumer psychology doesn't work like that. People see the 'Free Shipping' banner or button and their brain automatically says "You're getting a deal!"
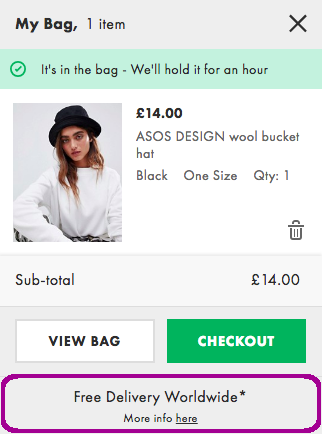
When offering free shipping, make sure it has pride of place on your site so that customers can't miss it–especially when they are checking out! This should help when it comes to increasing your conversion rate.
Google Analytics
As an online store owner, you are completely blind to the people who visit your store and make purchases if you do not have access to an analytics tool.
Google Analytics is free and can be linked to your ecommerce site by simply pasting a tracking code into the backend of your store. This works differently for each platform, so make sure you contact your current website host to find out exactly how to do this.
Once it is linked to your store, Google Analytics can give you access to an abundance of historical and real-time reports that tell you who is visiting your site, how they got there, and perhaps most importantly, their behaviour on-site.
With access to data like this, you can set benchmarks and easily monitor the effectiveness of your efforts to optimise your store for conversions and sales.
Top Tip If you take time to set up a conversion funnel in Google Analytics this can be a great way to augment the metrics you can pull directly from Shopify or BigCommerce.
Thanks for reading
Now you know which benchmarks to measure and how to measure them, optimising your ecommerce store will be a piece of cake. Or, as Sherlock Holmes would say, "Elementary, my dear Watson!"
Monitoring your conversion rate benchmarks and analytics, and improving the success of your ecommerce store is an ongoing task. The more you adjust, tweak, and measure, the more optimised your store will be.
Interested in print on demand for your next ecommerce venture? Check out our Shopify integration.